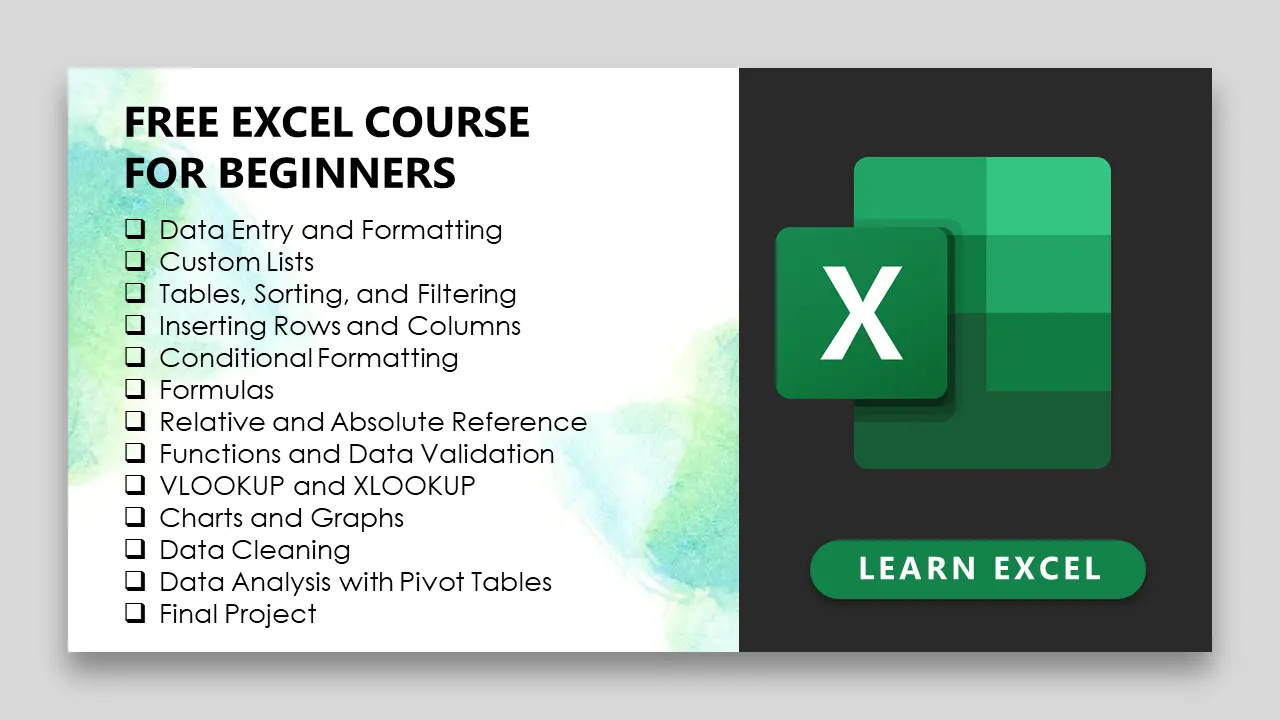
Excel is a great tool to learn even if you do not want to be a data analyst.
Whether you are a teacher, doctor, nutritionist, engineer, lawyer, entrepreneur, or student, Excel can help to organize your life and be productive.
Here are 5 benefits of learning Excel for any person regardless of profession or background.
ORGANIZING YOUR PERSONAL LIFE
Excel can help you to make spreadsheets and templates that you can use to organize your life, track your progress, or prepare for a task.
For example, I have made Excel and Google Sheets spreadsheets to manage monthly finances, prepare for weddings, set and track monthly goals, track and recommend books, track habits, and more.
These spreadsheets help me to stay organized, and motivated, and ultimately achieve my goals.
INCREASED CAREER OPPORTUNITIES
Proficiency in Excel is a valuable skill sought after by employers across different industries.
Many job roles, such as data analysts, financial analysts, project managers, and administrative professionals, require Excel proficiency.
By learning Excel, you enhance your employability and open up opportunities for career advancement or transition to roles that rely heavily on data analysis and management.
IMPROVED PROBLEM-SOLVING SKILLS
Excel requires logical thinking and problem-solving skills to analyze data and create efficient formulas.
By working with Excel, you develop a structured approach to problem-solving and learn to break down complex tasks into smaller, manageable steps.
This ability to approach problems analytically and find solutions can be applied to various real-life scenarios beyond Excel.
INCREASED EFFICIENCY AND PRODUCTIVITY
Excel can help you automate tedious tasks, such as data entry and calculations. This can save you a significant amount of time, which you can then use to focus on more strategic work.
For example, if you are in business and have a large spreadsheet of customer data, you can use Excel to create a formula that automatically calculates the total sales for each customer.
This would save you the time of having to manually calculate the total sales for each customer.
DATA ANALYSIS AND VISUALIZATION
Sometimes, the easiest way to communicate your ideas to others is by using simple charts, graphs, and other visuals.
Excel's charting capabilities allow you to create visually appealing graphs and charts to present your data in a more understandable and meaningful way.
You use data visualization tools in Excel to help you effectively communicate your ideas to investors, stakeholders, partners, etc.
These analytical and visualization features help in making informed decisions and identifying trends or patterns in data.
If you are interested in learning Excel, you can take my Free Excel Course for Beginners.
Until Next Time


